
How to Look Up Travis County Jail Population Data
Population data does not live in the inmate search. It comes from the Sheriff's Corrections Bureau, the county open-records process, and budget and planning reports. The Corrections Bureau page is the best starting point because it publishes the headline figures, the two facility sites, and the bureau sections that manage custody. Detailed demographic breakdowns are released through the county's open-records route rather than a live dashboard.
The Corrections Bureau page sets out the capacity and operations that drive the population.
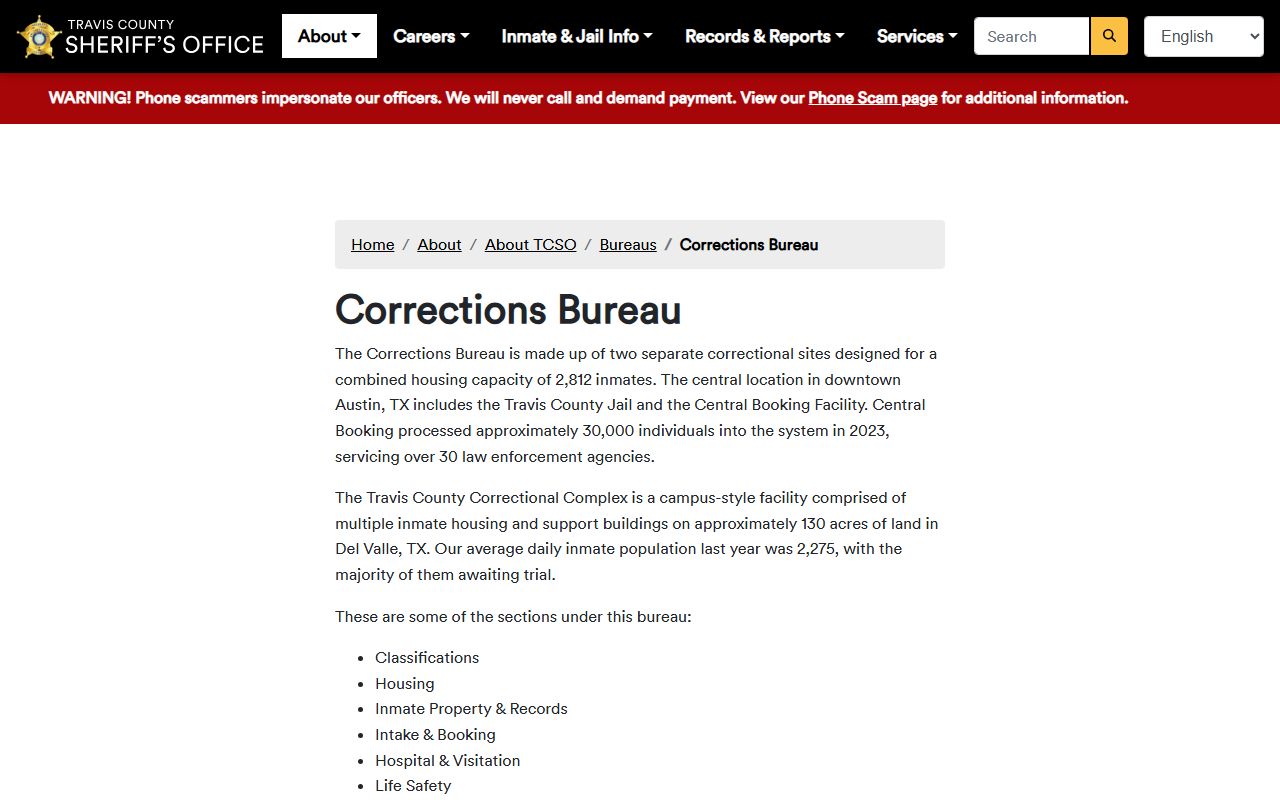
That page describes the two correctional sites and the bureau units that run intake, classification, and housing. For data on a specific person rather than the whole jail, use the Travis County inmate records search instead.
Travis County Jail Capacity Overview
The county runs two correctional sites with a combined housing capacity of 2,812 inmates. The downtown location pairs the Travis County Jail with Central Booking, the intake point for new arrests. The larger campus is the Travis County Correctional Complex on roughly 130 acres in Del Valle, with multiple housing and support buildings. Capacity is the designed number of beds, not the daily count, which usually runs below the ceiling.
The Sheriff's facilities page lists both sites and the security-screening notice for visitors.
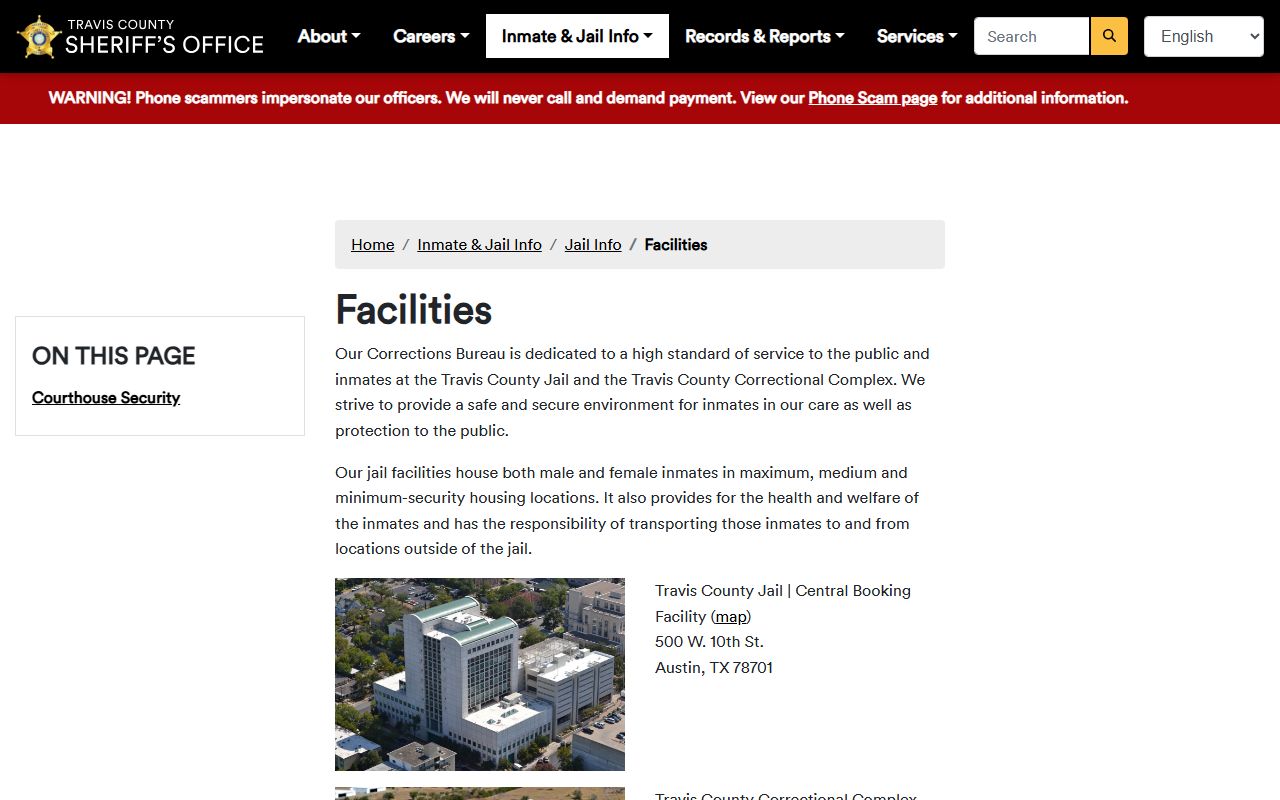
Both sites contribute to the combined capacity. The table below shows the facility figures from the Corrections Bureau.
| Facility / Site | Location | Capacity / Notes |
|---|---|---|
| Travis County Jail / Central Booking | 500 W. 10th St., Austin | Downtown jail and intake; part of the 2,812 combined capacity |
| Travis County Correctional Complex | 3614 Bill Price Rd., Del Valle | About 130 acres; multiple housing and support buildings |
| Corrections Bureau total | Two sites | 2,812 combined housing capacity |
Average Daily Population
The Corrections Bureau reported an average daily inmate population of about 2,275 last year. Measured against the 2,812 combined capacity, that works out to roughly 81 percent of designed beds, though daily peaks and unit-by-unit limits can push some areas higher. Average daily population is the standard way jails report their typical load, because the headcount changes every day as people are booked in and released.
This single figure carries a lot of weight in planning and budgeting. A jail running near capacity has less room to separate populations by classification, and pressure on beds is one reason the county invests in diversion. The figure is county-specific and comes from the Sheriff's own reporting, not a state estimate. Daily population also swings with arrest patterns, court schedules, and how quickly cases resolve, so any single day can read higher or lower than the yearly average without signaling a real trend.
Pretrial vs Sentenced Population
The most important fact about the Travis County jail is who is in it. The Corrections Bureau states that the majority of the average daily population is awaiting trial, not serving a sentence. That makes the jail mostly a pretrial facility, which is typical of county jails and very different from a state prison, where nearly everyone has been convicted. People held pretrial may be waiting on bond, a hearing, or a case resolution.
| Group | Status | Share of County Jail |
|---|---|---|
| Pretrial detainees | Charged, not yet convicted | Majority of average daily population |
| Sentenced county inmates | Convicted, serving a county term | Smaller share |
| Holds and transfers | State, federal, or other-county holds | Variable |
Because most people are pretrial, the page should not be read as a list of convicted offenders. A booking reflects a charge, and the outcome may differ once the case reaches court.
Misdemeanor vs Felony Population
The jail holds people on both misdemeanor and felony charges, and the class affects which court handles the case and which clerk keeps the record. Felony defendants flow toward the district courts and the District Clerk, while Class A and B misdemeanor defendants flow toward the county courts at law and the County Clerk. People can also be held on warrants, capias orders, probation violations, or pending mental-health and competency processes.
The county does not publish a fixed daily split of felony versus misdemeanor in the harvested sources, and inventing one would be misleading. For the case behind a charge, the court records portal and the arrest records page show the felony and misdemeanor record split in detail.
Demographic Breakdown
Travis County releases jail population demographics, such as race, ethnicity, sex, age, and charge class, through its open-records process rather than a live public dashboard. These breakdowns are useful for understanding who is held and for tracking change over time, but the exact current figures should come straight from the county release, not from a third party. The figures here do not include specific demographic counts, because those numbers move and must be pulled from the official source to be accurate.
If you need current demographic data, request it through the Travis County open-records process for the Sheriff's Office, which is the same public-information framework described on the public records page. That route returns the official, dated figures rather than an estimate.
Mental Health and Medical Population
A meaningful share of the jail population has mental-health or medical needs, and Travis County has built its system around that reality. The Corrections Bureau runs a Hospital and Visitation section and connects inmates to clinical support for trauma, addiction, and thinking errors through its inmate programs. The Sheriff has made mental-health reform a public priority, with an emphasis on moving people whose conduct stems from mental illness toward treatment when that is legally and clinically appropriate.
The county's inmate programs page describes the clinical and reentry support offered inside the jail.

This programming connects to the county's specialty courts, including mental-health diversion and the Veterans Treatment Court, which divert eligible people out of the standard jail path. Those programs are covered on the arrest records page.
Booking Volume at Central Booking
Average daily population measures who is in the jail on a given day. Booking volume measures how many people pass through over a year, and the two tell different stories. Central Booking processed about 30,000 individuals in 2023, serving more than 30 law-enforcement agencies. That throughput shows how busy the intake operation is, even though most of those people do not stay long.
High booking volume with a lower daily population means a large share of people cycle through quickly on bond, release, or a fast case resolution. It also explains why the inmate roster turns over constantly and why a name can appear and disappear within days. For how a booking is created, see the booking section on the inmate records page.
National and State Context
To judge whether a county jail count is high or low, researchers compare it to state and national rates. The Bureau of Justice Statistics publishes national jail data, including incarceration rates per 100,000 residents, and is the standard federal source for that context. Other research groups, such as the Vera Institute and the Prison Policy Initiative, track county-level and state trends over time.
The Bureau of Justice Statistics is the authority for national jail comparisons.
These sources are high-authority but national, not local, so they should be used for context rather than as a Travis County count. The table below compares the county's own reported metrics side by side; for rate-per-100,000 comparisons, use the BJS data directly.
| Metric | Figure | Source |
|---|---|---|
| Combined housing capacity | 2,812 | County (Corrections Bureau) |
| Average daily population | About 2,275 | County (Corrections Bureau) |
| Bookings processed in 2023 | About 30,000 | County (Central Booking) |
| Rate per 100,000 comparison | See national data | Bureau of Justice Statistics |
Population Trends Over Time
Travis County has managed real pressure on its jail population, tied to pretrial detention, mental-health needs, and planning for diversion. Official pages publish the latest booking and average-daily-population figures, while a full multi-year trend comes from county budget and planning reports and the open-records demographics releases. The harvested sources give the current snapshot rather than a five-year table, so a long trend should be built from those official reports.
The broad direction is clear from county priorities. The Sheriff's focus on mental-health diversion and the county's investment in specialty courts both aim to reduce the number of people held in jail when treatment is the better path. For year-over-year figures, request the planning and demographic reports through the county open-records process. Comparing several years of those official releases is the only reliable way to see whether the population is rising or falling, since a single month can mislead.
Searching for Travis County Inmate Records by Name
Population data is the focus here, not individual lookups. To find a specific person in custody, the name search lives on the inmate roster, not in these figures. Use the Travis County inmate records page to search by name, open a profile, and find a booking number, charges, and housing facility.
Where the Data Comes From
The figures here come from the Travis County Sheriff's Corrections Bureau and the county's facilities pages, with national context from the Bureau of Justice Statistics. County-specific numbers, the capacity, the average daily population, and the booking volume, are reported by the Sheriff. Comparative rates per 100,000 come from federal data, not the county. Demographic detail comes through the county open-records process.
Note: County figures here are reported by the Travis County Sheriff; any rate-per-100,000 comparison should be drawn from Bureau of Justice Statistics data, not assumed from these counts.